NetPlus comes with a charting feature, which is ideal for convenient stock market analysis and is packed with a variety of advanced features.
The Graph window of NetPlus lets you view any required Graph with various properties. The workspace also has most of the common operations placed in the toolbars of the Graph window so that you can have quick access to whatever functionality you need to carry out with Graphs.
The following figure illustrates the main parts of the Graph window:
Graph window
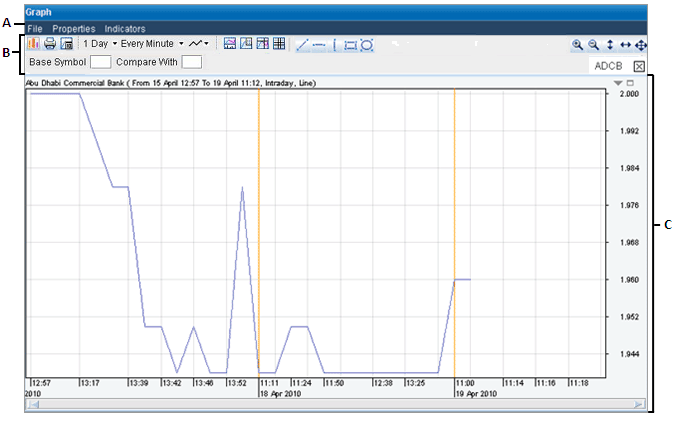
A: Menu bar B: Upper Toolbar C: Graph Area
Menu Bar - Contains the Main menus for performing various tasks.
Upper Toolbar - Contains quick access icons for the main Graph features.
Graph Area - Displays the current Graph as you create and edit it.